"Blog traffic is up 120% y/y!"
Picture it: you've just communicated that excellent result to your client. And while it extracted a smile, the delivery didn't inspire the fanfare you expected.
Instead, the client responds with: "What does that mean?"
As search marketers, it's easy for us to live in number land. But, when reporting performance to clients that don't, stats and metrics aren't quite enough.
A 120% increase in traffic is incredible. But, why did that occur? Better yet, what's the value of that traffic gain to the business?
This is where the gold lies. Instead of delivering performance metrics, we should deliver actionable insights. And that's exactly what I'm going to guide you through here.
Passing the "So What?" Test
At first, the client's response ("What does that mean?") seems harmless. However, a client that doesn't understand the data may also find it difficult to see the value you deliver. And a client that doesn't see the value...may not be your client for long.
At Uproer, it's our goal to ensure every single one of our performance reports passes what we call the "So What?" test. For every critical metric we plan to discuss, we ask ourselves why it matters and what it means to our overarching search strategy.
In other words, we ask ourselves "So what?" so that our clients don't have to. And if our report doesn't answer that question, we go back to the drawing board.
The Solution: Insights Fed by Data
How do you answer "So what?" By using the data you collect to develop actionable insights. In fact, it's a little bit like storytelling. Let's dive in, shall we?
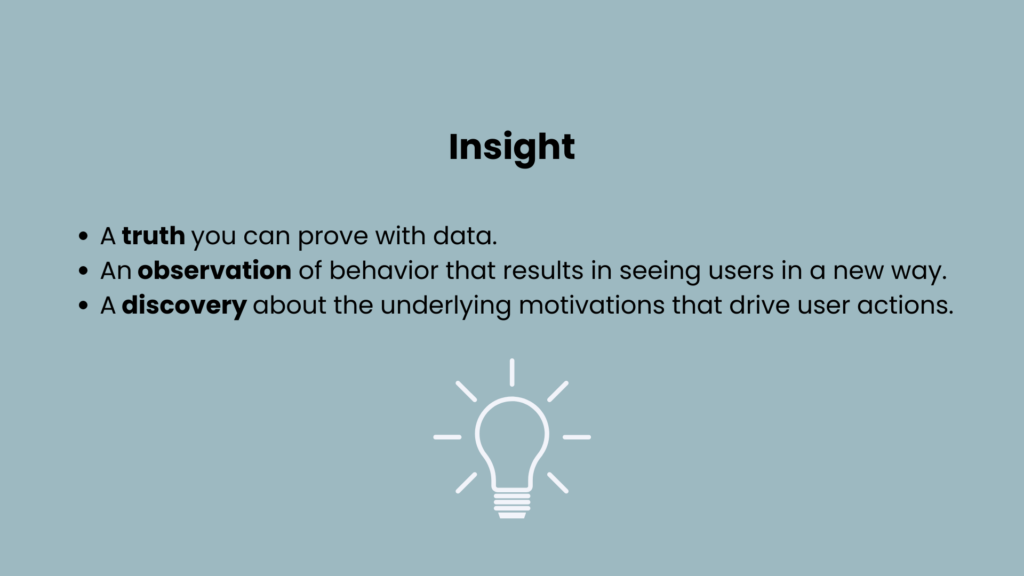
First, let's define what an insight is. At Uproer, we define an insight as:
- A truth you can prove with data.
- An observation of behavior that results in seeing users in a new way.
- A discovery about the underlying motivations that drive user actions.
As a writer, I love telling a good story. In fact, you can give me words over data any day. So, I like to think of an insight the same way I do about a good plot.
First, there's the exposition, where an author establishes the characters (your users) and begins to tease the primary conflict (their actions). This is the truth we can prove with data.
Next, there's the rising action, or in this case, the observation. Data points show user behavior acting in an interesting way. Charts rise and fall, conflict builds, and we begin to feel the pull to dig deeper.
Finally, the climax occurs. It's the "aha" moment of discovery, where all of our digging ends as we finally pinpoint what's driving user actions.
The result? An insight that details the data as well as the why and "So what?" behind it.
Next Steps: From Insights to Action
Oh, it gets better. The greatest benefit of gathering insights is that those same "aha" moments can drive strategic actions.
These are actions that both you and the client must take to reach your search marketing goals. Plus, these actions show your clients that you know exactly what to do to improve a decrease or repeat an increase.
Insights and actions are the two key building blocks of an effective performance report. And for us Uproerians, we know that effective reporting enables us to:
- Stay current to understand and communicate the immediate impact of our work and what we're doing in the near future to move toward our goals.
- Understand pitfalls and make plans to improve fast.
- Demonstrate the true impact our work is driving for our clients.
Insights & Action Examples
Okay, but what does an insight and an action look like? I hear you. And while I hate to do this, I'm going to give you the blanket marketing response: it depends.
There are endless observations, insights, and actions you may uncover in your client's data. But here are a few examples you may be able to draw some inspiration from.
| Observation | Insight | Action |
| Recipe round-ups are increasing in traffic the month before Christmas | Users are looking for recipes in advance to prepare for the holiday | Publish recipe round-ups 1-2 months in advance |
| Product pages for sweaters are declining in clicks for the month of June | Users aren't looking for sweaters in the summer | Updates product pages with images of sweaters being worn with summer items |
| A once well-performing blog post has now dropped in rank | Two new competitor pieces are now out-ranking the blog post in the SERP | Update and re-optimize the blog post to improve its value |
| A product review page on your website is experiencing a decrease in clicks and impressions | The page is sharing SERP space with websites featuring reviews of your product | Optimize the product review page with keywords to reach the intended audiences |
How to Build an "Insightful" Report
Understanding what insights and actions look like is the first step in building a valuable and insightful report. But how do you uncover the observations, insights, and actions to include? You can start by following these seven steps.
#1. Take an Outcome-Driven Approach
Building an insightful report begins before you even open Google Analytics. The first step in reporting is to take an outcome-driven approach to search strategy. In other words, you must understand your client's goals so you can align your search strategy execution with those aspirations.
Otherwise, there's nothing to report on, is there?
Only after you understand the client's business goals can you define the accompanying search marketing goals. And only after you define those search marketing goals can you use data to track and report on progress (which is where the real fun begins).
#2. Make a Hypothesis
When building your report, we recommend never starting with a blank slate. Instead, start the process with a hypothesis. This hypothesis can be inspired by everything from SEO trends to current events to past performance insights. Just make sure it aligns with your goals.
A hypothesis might look like this:
We saw a decline in clicks for our ice cream bar product pages in October last year. Shoppers aren't looking for ice cream as the weather turns colder. Since it's September, and fall is on the way, I hypothesize that we'll start to see a decrease in clicks for ice cream bar pages.
Making a hypothesis first gives you a place to start when faced with the endless amount of data in your analytics tools. As you dig deeper, your hypothesis will lead to more and more insights.
#3. Make Observations Based on Your Hypothesis
Is your hypothesis correct? In this step, you'll need to take note of data that either confirms or denies your hypothesis and make observations as you go along.
For example, if the hypothesis is correct, what's driving the result (channels, pages, keywords, etc.)? What does the result look like Y/Y and P/P? How do those observations relate to your big numbers, such as revenue and traffic?
Take note of any interesting observations you make. Your research may also lead you to new hypotheses that you can dig further into.
#4. Take Note of "Woah" Moments
As you work through your data and observe, you may stumble upon data points that make you grab ahold of your desk, look wide-eyed at your computer screen, and say "Woah."
At Uproer, we call these data points the "what is that?" data. And they're super important to dig into. Follow the data point and be curious about what it means to other pieces of data. Digging deeper into these data points often leads to a bigger insight—so keep going.
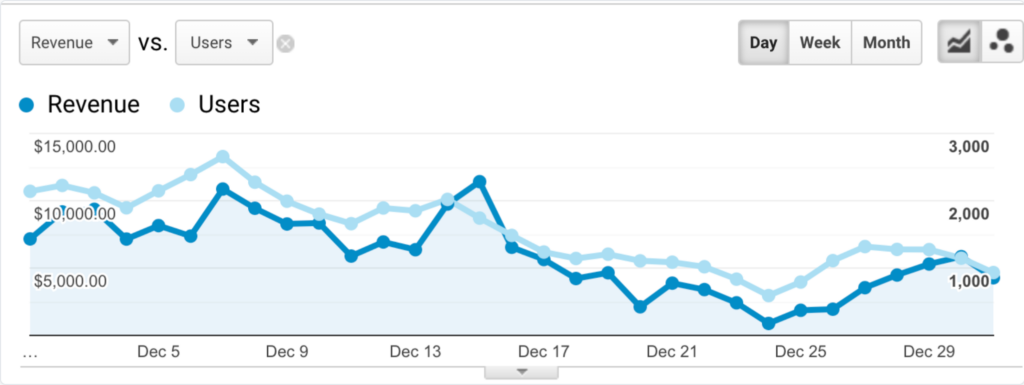
In this example, we see that revenue spikes on December 15th but then falls off until December 24th. What gives? We can also see that revenue is following users.
What looks scary at first really isn't. In this example, the shipping cut-off date was December 15th, and the sale ended on December 20th. Plus, it's 10 days away from Christmas. It all starts to make sense, doesn't it?
#5. Find Patterns & Trends
At this point, you should have quite a few interesting and raw data points to use as fodder for your performance report. Compile all of your raw data into one place, such as a spreadsheet or a Google doc. You'll then want to categorize the data and organize it in a way that makes sense to you.
As you manipulate your data, you may start to see patterns and trends emerge. Highlight these! Patterns and trends will inevitably lead you to go deeper, searching for missing data points and expanding.
After you complete your initial review, take a gander at the past performance to better understand the patterns and trends you've uncovered.
Compare your data to last year, last period, last sales period...whatever makes the most sense for comparison. Doing this is critical to uncovering the truth in your data.
#6. Turn Data Into Insights
Alright, let's take a quick breather. You've made it through your data analysis, so give yourself a pat on the back. Ready? It's time for the best part.
You've uncovered several key points of data that illustrate current performance. And heck, you might've even started putting together your presentation (overachiever 😉). But right now, all you have is data.
We want to turn that data into actionable insights. I love a good full-circle moment, don't you? There are three steps to creating actionable insights:
- Define the bigger picture: It's important to know that not all data points you gather will lead to actionable insights. Focus your attention on bigger trends and concepts first. Using your data points, ask yourself, "So what?" to determine the bigger picture. This will lead you to your insight.
- Create viable solutions: With insight and data points in hand, you can now brainstorm viable solutions. Ask yourself: How can you impact or change the performance data? We recommend defining 2-3 solutions.
- Define the "how": In this step, you're going to define how you'll implement the solutions in Step #2 to make an impact. Do you need to make some content updates? Do you need to mock up some website pages? Do you need to add a new module to your product pages? Whatever the "how," just make sure it works for both impact and effort.
#7. Present Creatively & In a Way Your Client Understands
You've now analyzed your data, uncovered your insights, and determined the next steps. This is the gold that should make up your performance report. The final step is to build it.
Lead With Insights First
When building your report, lead with your important insights first. This is what the client came for, not pages of numbers and cold data. Then, illustrate how you plan to make an impact on each insight by discussing the actions you're going to take.
Get Creative
When you hear the term "performance report," it's easy to see an image of a lengthy document chock full of numbers and jargon and bleh. Your report doesn't have to follow suit.
Instead, get creative. Illustrate your data and insights using compelling visuals (like charts and graphs). This is easy to do with Looker Studio and other tools like Canva.
It doesn't have to stop there. If your client enjoys a good laugh, throw in a GIF or an emoji. Or, tell a joke to break up the monotony. Remember: "search marketing report" doesn't have to be synonymous with "stuffy."
Speak Your Client's Language
If there's one thing you take from this, let it be this truth: you must speak your client's language to truly communicate your value.
Not all clients are CMOs or search marketing experts. In fact, I would argue that many of your clients came to you because they don't know search. How could they possibly understand some complex data points thrown into a Google slide?
In every performance report that you do, make sure to speak your client's language. First, make sure you're asking the right questions from the start of an engagement. Align on the KPIs that matter most to your client and then report on those key KPIs throughout the engagement.
You must also word your insights in a way they'll understand. Are they SEO beginners? Avoid the search marketing jargon and stick to the facts. Are they a skilled marketing team? Feel free to get a bit more technical.
Above all, remember: "So what?" isn't your friend; you must clearly communicate the incredible value you're delivering.
It's Time to Dig Deeper Than Your Data
The work you do for your clients is incredibly valuable. You owe it to yourself to communicate that value to your clients. The best way to do that is by digging deeper than your data and gathering actionable insights.
Want to learn more about gathering insights? Need search marketing support? We're here to help. Reach out to the Uproer team today.