Google Search Console is not a great keyword reporting tool. You can’t save custom reports. You can’t create your own filters. And, you’re limited to 1,000 results. These limitations make analyzing organic search data a time-consuming, and often fruitless, task.
Although improvements are coming to Search Console, you can get the most out of the data today by integrating it with Google Data Studio. There, you can do everything I mentioned above that isn’t possible in Search Console.
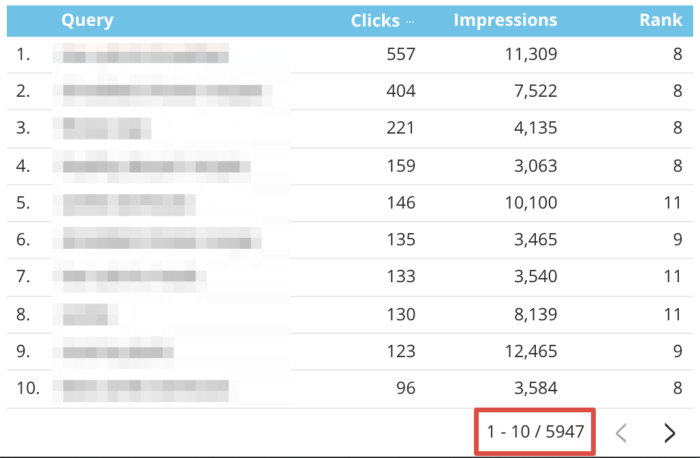
Plus, you get way more keyword data! See below - 5,957 keywords!
In this post, I’ll share a few ways that I’ve been able to get much more value out of Search Console using Data Studio. The primary benefit is that you can save all of the reports and configurations so that you can access the always-updated data at anytime.
Here's what you'll learn:
- Create a Filter Control to Separate Brand and Non-Brand Queries
- Create a Filter Control to See Short-Tail vs Long-Tail Keywords
- Create a Filter to View Keywords at Specified Ranking Positions
See live examples of all these filters in this Data Studio report:
Create a Filter Control to Separate Brand and Non-Brand Queries
If you want split your brand and non-brand keywords in Search Console, you’re limited to entering one phrase into the query filter.
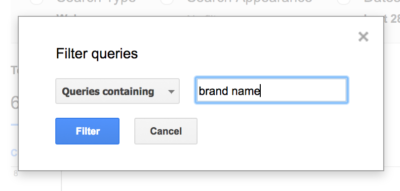
This isn’t much help if your website ranks for multiple brand names or has brand misspellings. But with Data Studio, you can create a filter that includes any and all variations of your brand.
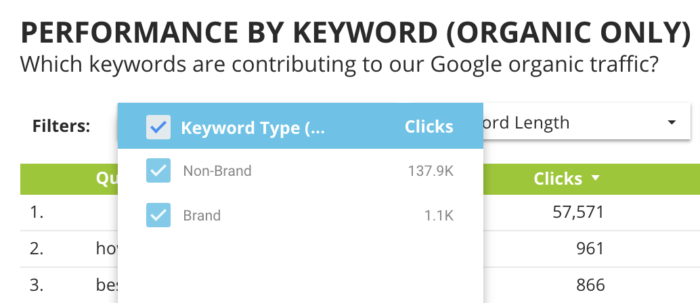
Here’s what the result looks like:

Here’s how you can create your own:
- After integrating Search Console with Data Studio, create a table with the data you’d like to view
- With your table created, add a filter control
- Set your data source to your Search Console profile
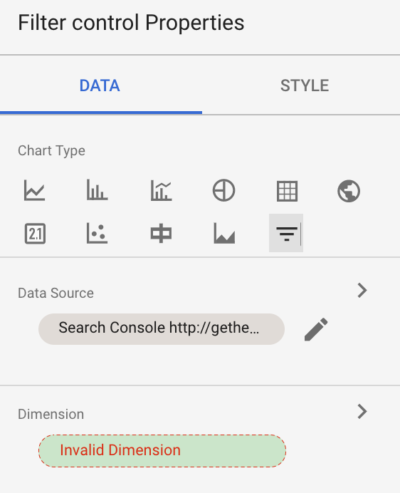
- Click on the green oval to set a dimension
- Select “Create New Dimension”
- Name your new brand / non-brand keyword filter
- Write the formula for your new dimension using a CASE statement to segment brand terms from non-brand terms
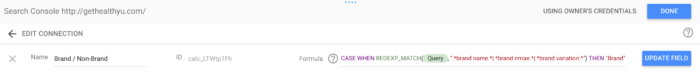
- Here’s how you should enter the CASE statement:
CASE WHEN REGEXP_MATCH(Query, ".*brand name.*|.*brand nmae.*|.*brand variation.*") THEN "Brand" ELSE "Non-Brand" END - Breaking down the CASE statement:
- CASE WHEN
- This is how you open a CASE statement
- REGEXP_MATCH(Query, “.*regular expression.*”)
- Using this formula, you can write a regular expression that captures all the variations of your brand names
- Add “.*” before and after your brand phrases to capture all of them
- Use the “|” symbol to separate unique variations of your brand phrases
- THEN “Brand”
- This categorizes every keyword that meets your regular expression rules as a “Brand” query
- ELSE "Non-Brand"
- Every keyword that does not match your regular expression will be categorized as “non-brand”
- END
- Ends the CASE statement
- CASE WHEN
- Hit “Done” to save your new dimension
- Go back to your filter control and select your new dimension
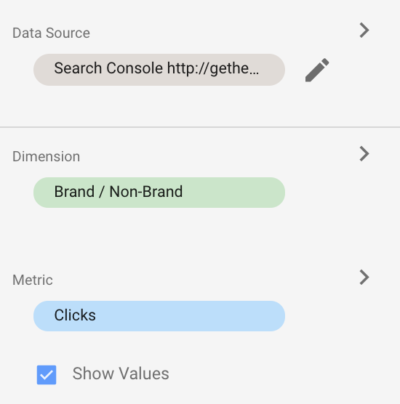
- Specify a metric to display in your filter control (I use Clicks)
You now have a filter that allows you to quickly switch between viewing brand and non-brand keyword performance.
Create a Filter Control to See Short-Tail vs Long-Tail Keywords
I know when I dive deep into Search Console, I’m often searching for untapped long-tail keyword opportunities. However, there’s no filter for keyword length. So, I created one in Data Studio using a CASE statement.
Here’s what the result looks like:
This filter lets you view keywords by their word count.
Here’s how you can create your own:
- After integrating Search Console with Data Studio, create a table with the data you’d like to view
- With your table created, add a filter control
- Set your data source to your Search Console profile

- Click on the green oval to set a dimension
- Select “Create New Dimension”
- Name your new keyword word count filter
- Write the formula for your new dimension using a CASE statement to categorize keywords by their word count
- Here’s how you should enter the CASE statement to categorize keywords by word count for up to 8 words (you can do more or less by lengthening or shortening this statement):
CASE WHEN REGEXP_MATCH(Query, "^[a-zA-z0-9]+ [a-zA-z0-9]+ [a-zA-z0-9]+ [a-zA-z0-9]+ [a-zA-z0-9]+ [a-zA-z0-9]+ [a-zA-z0-9]+$") THEN "7 Words" WHEN REGEXP_MATCH(Query, "^[a-zA-z0-9]+ [a-zA-z0-9]+ [a-zA-z0-9]+ [a-zA-z0-9]+ [a-zA-z0-9]+ [a-zA-z0-9]+$") THEN "6 Words" WHEN REGEXP_MATCH(Query, "^[a-zA-z0-9]+ [a-zA-z0-9]+ [a-zA-z0-9]+ [a-zA-z0-9]+ [a-zA-z0-9]+$") THEN "5 Words" WHEN REGEXP_MATCH(Query, "^[a-zA-z0-9]+ [a-zA-z0-9]+ [a-zA-z0-9]+ [a-zA-z0-9]+$") THEN "4 Words" WHEN REGEXP_MATCH(Query, "^[a-zA-z0-9]+ [a-zA-z0-9]+ [a-zA-z0-9]+$") THEN "3 Words" WHEN REGEXP_MATCH(Query, "^[a-zA-z0-9]+ [a-zA-z0-9]+$") THEN "2 Words" WHEN REGEXP_MATCH(Query, "^[a-zA-z0-9]+$") THEN "1 Word" ELSE "8+ Words" END - Breaking down the CASE statement:
- CASE WHEN
- This is how you open a CASE statement
- REGEXP_MATCH(Query, “^[a-zA-z0-9]+$...”)
- Using this formula, you can write a regular expression that counts the number of spaces in a query to determine how many words it’s composed of
- THEN “[#] Word[s]”
- This categorizes every keyword by its word count
- ELSE "8+ Words"
- I cap the categorization at 8+ words. You can choose differently
- END
- Ends the CASE statement
- CASE WHEN
- Hit “Done” to save your new dimension
- Go back to your filter control and select your new dimension
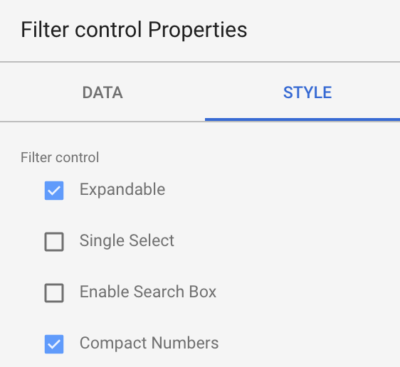
I recommend selecting the “Expandable” style option for easy filtering.
Now, you can filter keywords by their word count to quickly assess short- to long-tail optimization opportunities.
Another Method for Word Count (Updated 6/1/2019)
I received an email from a reader, Jan Nachtigal, who developed another (perhaps more accurate) way to acheive the same result. Check out Jan's method below:
- Create a formula for calculating word count:
LENGTH(REGEXP_REPLACE(Query, "[^\t\n\f\r ]", "")) + 1 - Then, create a custom dimension using a CASE statement for word count:
CASE WHEN WordLength=1 THEN "1 word" WHEN WordLength=2 THEN "2 words" WHEN WordLength=3 THEN "3 words" WHEN WordLength=4 THEN "4 words" WHEN WordLength=5 THEN "5 words" WHEN WordLength=6 THEN "6 words" WHEN WordLength=7 THEN "7 words" WHEN WordLength=8 THEN "8 words" ELSE "8+ words" END
Create a Filter to View Keywords at Specified Ranking Positions
If you want to view, say, keywords that rank between position 4 and 7 in Search Console, your only option is to export 1,000 keywords to a CSV. Using Excel or Sheets, you can then filter by ranking position.
Read: How to See the Ranking Page URL for Your Keywords in Google Search Console
By building this filter into Data Studio, you’ll save yourself time and and be able to view a lot more keyword data.
Here’s what the result looks like:
![]()
Here’s how you can create your own:
- In Data Studio, select the table that you’d like to apply this filter to.
- In the “Table properties” menu, scroll to the bottom and select “Table filter”
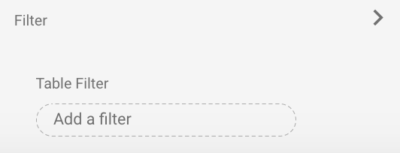
- Click “Create a Filter”
- Name your filter
- Use the options to specify how you’d like to filter the ranking positions
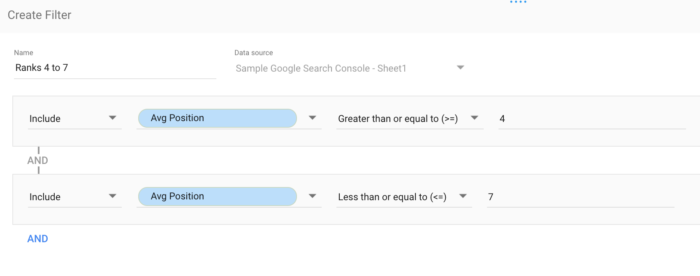
- Click “Save”
Now you have a table that filters keywords by the ranking positions you specified, making quick analysis for optimization opportunities possible.
By using Data Studio you can get so much more value out of Search Console data. Let me know if you come up with any new filters or helpful functionalities and I'll add them to this list.